Correlation Between Children with Autism Spectrum Disorder Receiving Evaluation by 36 Months and Race/Ethnicity- Madiha S.
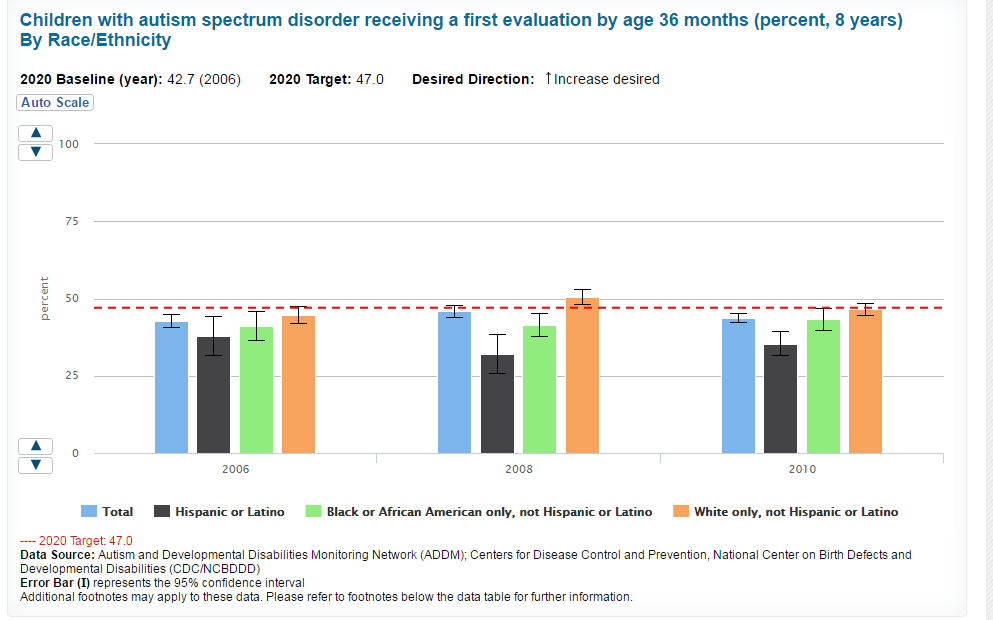
This graph shows the correlation between Autism evaluations before the age of 36 months and race/ethnicity. In 2006, the Hispanic/Latino population had 37.9% of children younger than 36 months evaluated for Autism, which was the lowest of that year. Then the Black/African American had 41.1% evaluated in 2006. Then the White population had the highest percent at 44.7% in 2006. The total/average in 2006 was 42.7% of children evaluated for Autism before they were 36 months. In 2008, the percent of children evaluated increased except for the Hispanic/Latino population. The Black population had 41.1%, the White population had 50.4%, and the Hispanic population had decreased to 31.9%. Later in 2010, all increased except for the White population. The Black population had 43.3%, Hispanics had 35.3%, and the White population had 46.5%
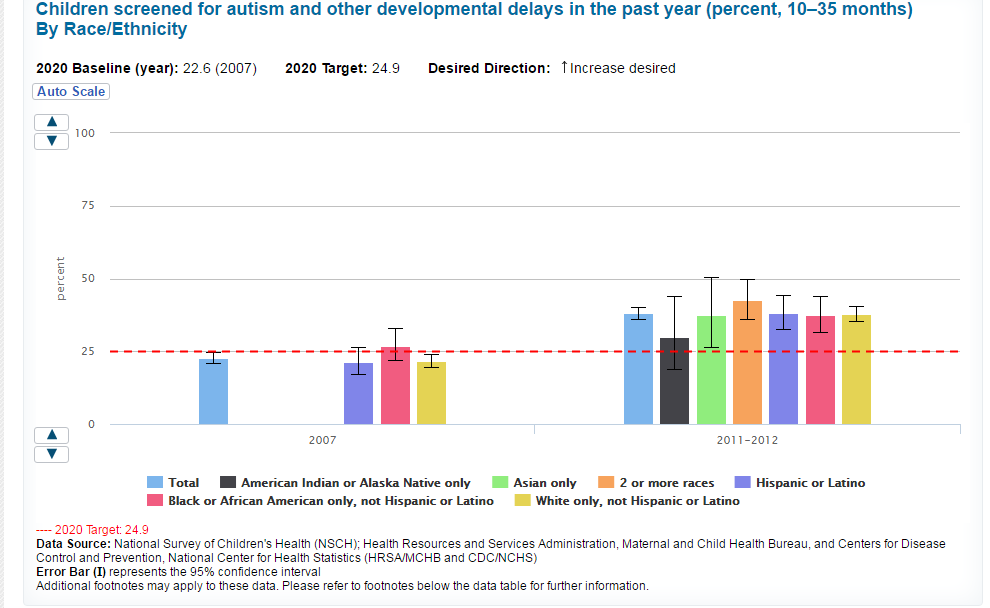
Children (10-35 Months) Screened for Autism By Race/Ethnicity - Bridget Klug

This graph shows the percentage of the different races that are screened at the age of 10 to 35 months. In 2011-12, children born of two or more races were screened the most. Native American and Alaskan Native children were screened the least.
Children with Autism Spectrum Disorder Receiving Evaluation by 36 months of age - Phylicia B.
As seen on the graph, the red dotted line is the target amount of children to be evaluated by 2020. The only group to pass that target was the orange block (White only) and the amount goes down in two years. The black block (Hispanic or Latino), had the lowest rates of evaluation, and fluctuated up and down from 2006 to 2010. The green block (Black or African) is the only group that does not go down over the course of the four years. Although it does not surpass the target rate, it has a steadier growth rate.
